
Are forex signals reliable? Why an "80% win rate" means less than you think, and a 12-point checklis
 Systemly Team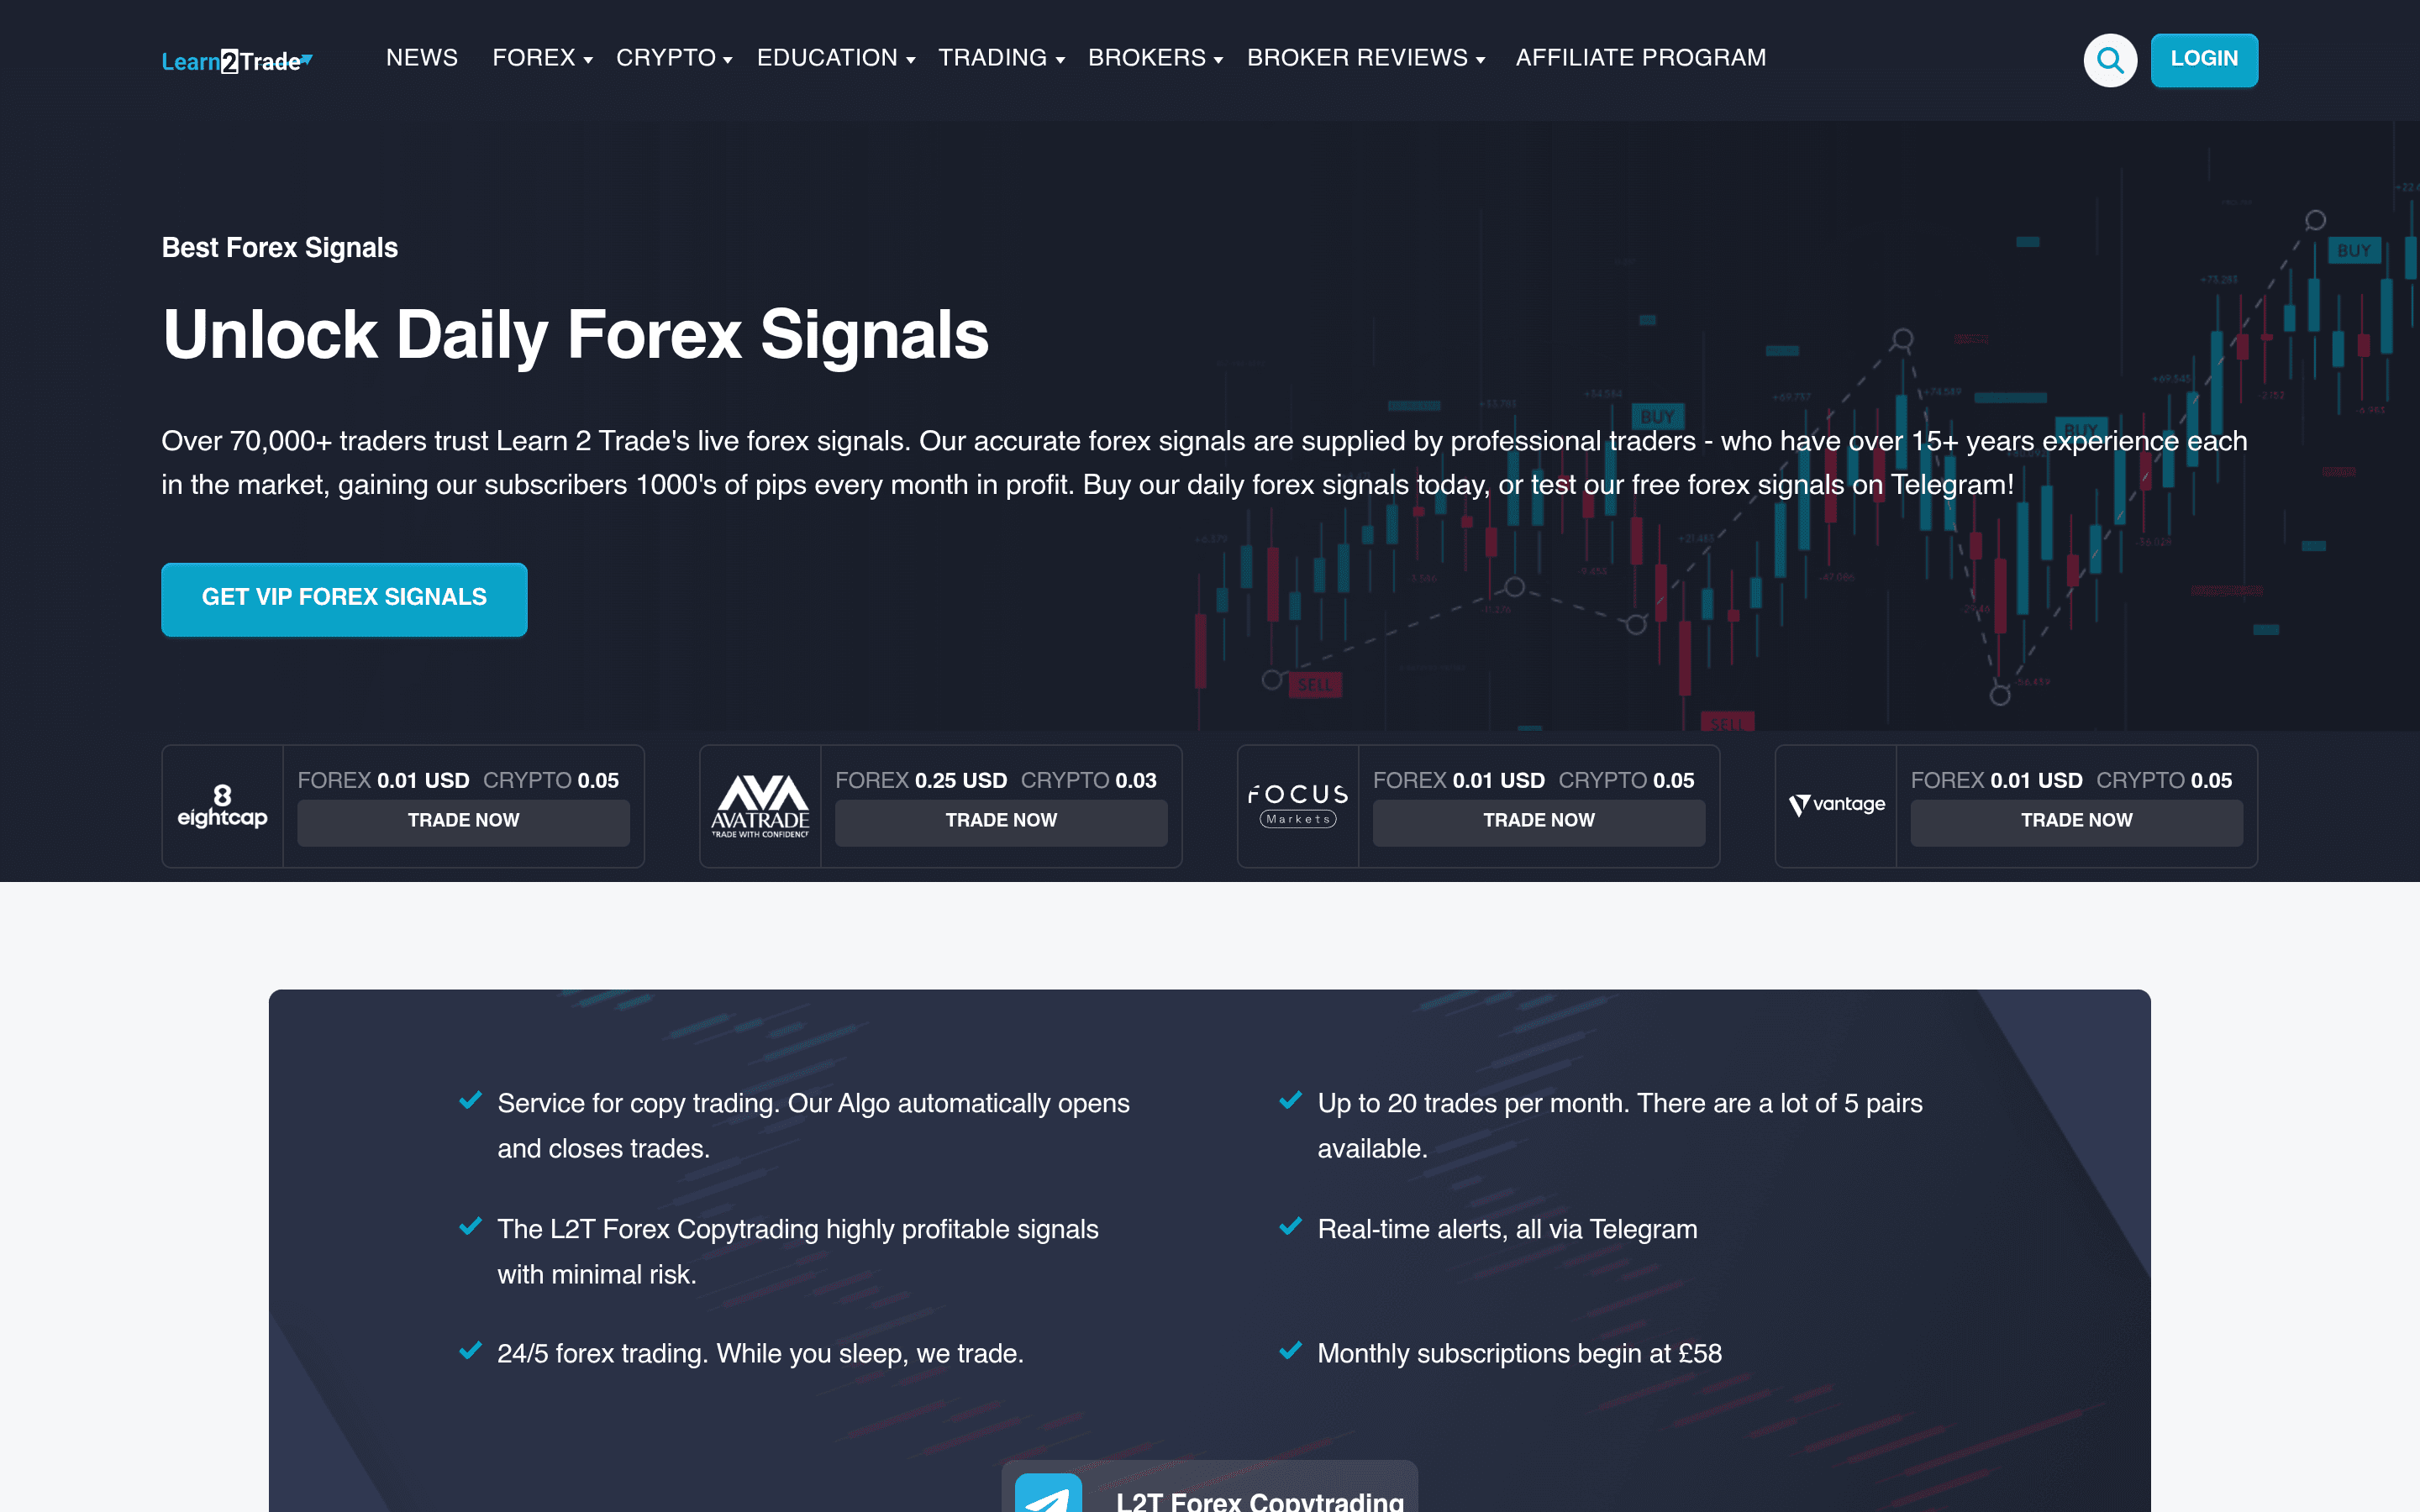
Three numbers are doing a great deal of selling this month: 76%, 80 to 95%, and 95%. They are headline figures from three products you can buy in September 2026. Learn2Trade advertises a "76% success rate". Forex GDP claims an "80 to 95% success rate". ChartAI, an AI chart app at profitgpt.app, advertises "95% Signal Accuracy". We found no independent verification of the first, the second links a Myfxbook account that has not been audited, and the third states no method.
None of that proves the numbers are wrong. It proves something more useful: on its own, a win rate cannot tell you whether a signal service is any good. A service can win three trades in four and still lose money. To judge a signal, you need the distance to the stop, the distance to the target, the cost of each trade and a record of every outcome, including the losers. A beginner who wants to see the whole plan and what happened to it is better served by a tool that shows its working, such as Systemly (systemly.ai), than by any headline percentage.
Quick answer: Forex signals are only as reliable as the evidence behind them, and a headline win rate is weak evidence. A target 10 pips away with a stop 30 pips away needs a 75% win rate just to break even, and loses money once a 1-pip spread is added. Paid services such as Learn2Trade and Forex GDP suit traders who want frequent calls and can check the record themselves. Systemly suits a beginner who wants the full plan, the reasoning and a recorded outcome for every plan instead of a headline percentage.
Systemly publishes this comparison. We have tried to be fair, and every competitor fact below is sourced and dated 24 September 2026.
This article does one thing before anything else. It shows, in plain arithmetic, why a coin could post a 75% win rate. After that, every signal advert reads differently. The checklist near the end turns that into twelve questions you can ask any provider, including us.
Do forex signals work? Start with the geometry, not the percentage
Every trade has two exits. One is the target, where you take profit. The other is the stop, where you accept you were wrong. A win rate counts how often price reached the first exit before the second. It says nothing about how far apart they were.
That matters because the closer exit gets hit more often, whatever the skill of the person who set it. If the target is close and the stop is far away, you will "win" most of the time. You will also lose much more on each loss than you make on each win.
The common mistake is to compare two services by win rate alone. The consequence is that you pick the one with the tightest target and widest stop, which looks brilliant in the advert and drains the account in practice. Think of it like judging a shop by how often it sells you something, without looking at the receipt. A shop that sells you ten sweets and one overpriced television has made eleven sales. The television is the number that matters.
The arithmetic, one step at a time
We will use round numbers so you can follow along with a pen. These distances are an illustration. We are not saying any named service uses them.
Example one: a 10-pip target and a 30-pip stop
Step 1. Work out the break-even win rate. Divide the stop by the total of the target and the stop. 30 ÷ (10 + 30) = 30 ÷ 40 = 75%.
Step 2. Check it over 100 trades at a 75% win rate.
- 75 wins × 10 pips = 750 pips gained.
- 25 losses × 30 pips = 750 pips lost.
- Net result: 0 pips.
Per trade, that is 0.75 × 10 − 0.25 × 30 = 7.5 − 7.5 = 0 pips, before costs.
Step 3. Add the cost of trading. Say each trade pays a 1-pip spread.
- 100 trades × 1 pip = 100 pips of costs.
- Net result: −100 pips, or −1 pip per trade.
So a service could honestly win 75% of its trades with these distances and still lose you money.
Example two: why a coin flip can "win" 75% of the time
Now imagine a trader with no skill at all. They pick a direction at random and set the same 10-pip target and 30-pip stop.
If price moves randomly, the chance of touching the nearer level first is roughly the distance to the far level divided by the total of both distances. Here that is 30 ÷ (10 + 30) = 75%.
A coin-flip trader "wins" about 75% of the time with that geometry. That is the no-skill baseline. Any service quoting a 75% win rate on those distances has shown you nothing beyond what chance would deliver.
Example three: the reverse, where a low win rate is fine
Flip the distances. The target is 30 pips away and the stop is 10 pips away.
Step 1. Break-even win rate: 10 ÷ (30 + 10) = 10 ÷ 40 = 25%.
Step 2. Suppose this trader wins 40% of the time.
- Per trade: 0.4 × 30 − 0.6 × 10 = 12 − 6 = +6 pips, before costs.
- Take off the same 1-pip spread and it is +5 pips per trade.
That trader loses more often than they win. The arithmetic is still positive. A 40% win rate looks worse than 75% in an advert, and the maths says the 40% trader is in better shape.
That is the whole lesson. A win rate means nothing unless you also know the distances to the target and the stop, and the costs.
How a headline win rate gets flattered
Beyond geometry, there are ordinary ways a published win rate can drift away from what a follower actually experiences. None of these is an accusation against a named firm. They are patterns readers should know how to spot.
Entry prices that never filled
One r/trading212 user described a gold channel this way: "some of their entry prices actually do not execute because the gold price did not reach it. But they will still use that entry price to count toward their TP levels" (r/trading212 thread). If a trade never opened, it cannot be a win. Counting it as one inflates the rate.
Several targets, one "win"
Many signals list two or three take-profit levels. If the first target counts as a win even when price then reverses and hits the stop, the win rate climbs while the account does not. Entry zones instead of exact prices, several take-profit levels and 1-minute screenshots are common tactics in gold channels, according to Vasily Trader's write-up on gold signal channels.
Wins posted after the fact
An r/FakeGuru user put it simply: "Everyone there posted their wins after the fact… Never before it happened. Always after." (r/FakeGuru thread). A call posted after the move cannot lose.
Nobody can check the record
A Myfxbook link is better than nothing. Myfxbook is widely treated as the reference point for verified account statistics. A linked account is still different from an audited one, and the Forex GDP account has not been audited.
Why Systemly publishes no headline figure
Leaving out a headline percentage is a choice on Systemly's part, not an oversight.
That is not a hint that the number would be flattering, or that it would be embarrassing. It is a judgement about what helps a beginner. You have just seen that a single percentage, stripped of the distances and costs behind it, can mislead in either direction. Publishing one would invite exactly the comparison this article warns against.
What it shows instead is the working.
- Before the trade: the direction, or a plain statement that nothing is worth trading right now; one entry level; the stop, which is "the price that says the idea was wrong"; targets in steps; a position size for your own balance and risk %; and plain-English reasoning, including what would make the trade fail.
- After the trade: it follows each plan and records which level price reached, when it got there, and how far price went against the trade first. The losing plans are tracked in exactly the same way as the winners.
You can see finished plans in the public feed of community scans, and opening one in full needs a free login. Each plan sets out the stop and target distances, and Systemly's tracking records what happened next. That lets you do the thing this article has been arguing for: look at the stop distance, the target distance and the outcome together, one plan at a time.
For readers who want the one-line definition: Systemly is a UK-built forex and gold trade-planning app that turns live price data into a complete trade plan, with entry, stop, targets, position size and plain-English reasoning, and teaches the terms in a built-in academy of 32 courses.
Signal services side by side
The table sets the three providers with headline figures against a generic Telegram VIP group and Systemly. Every competitor fact is from the provider's own page or a named review source, checked on 24 September 2026.
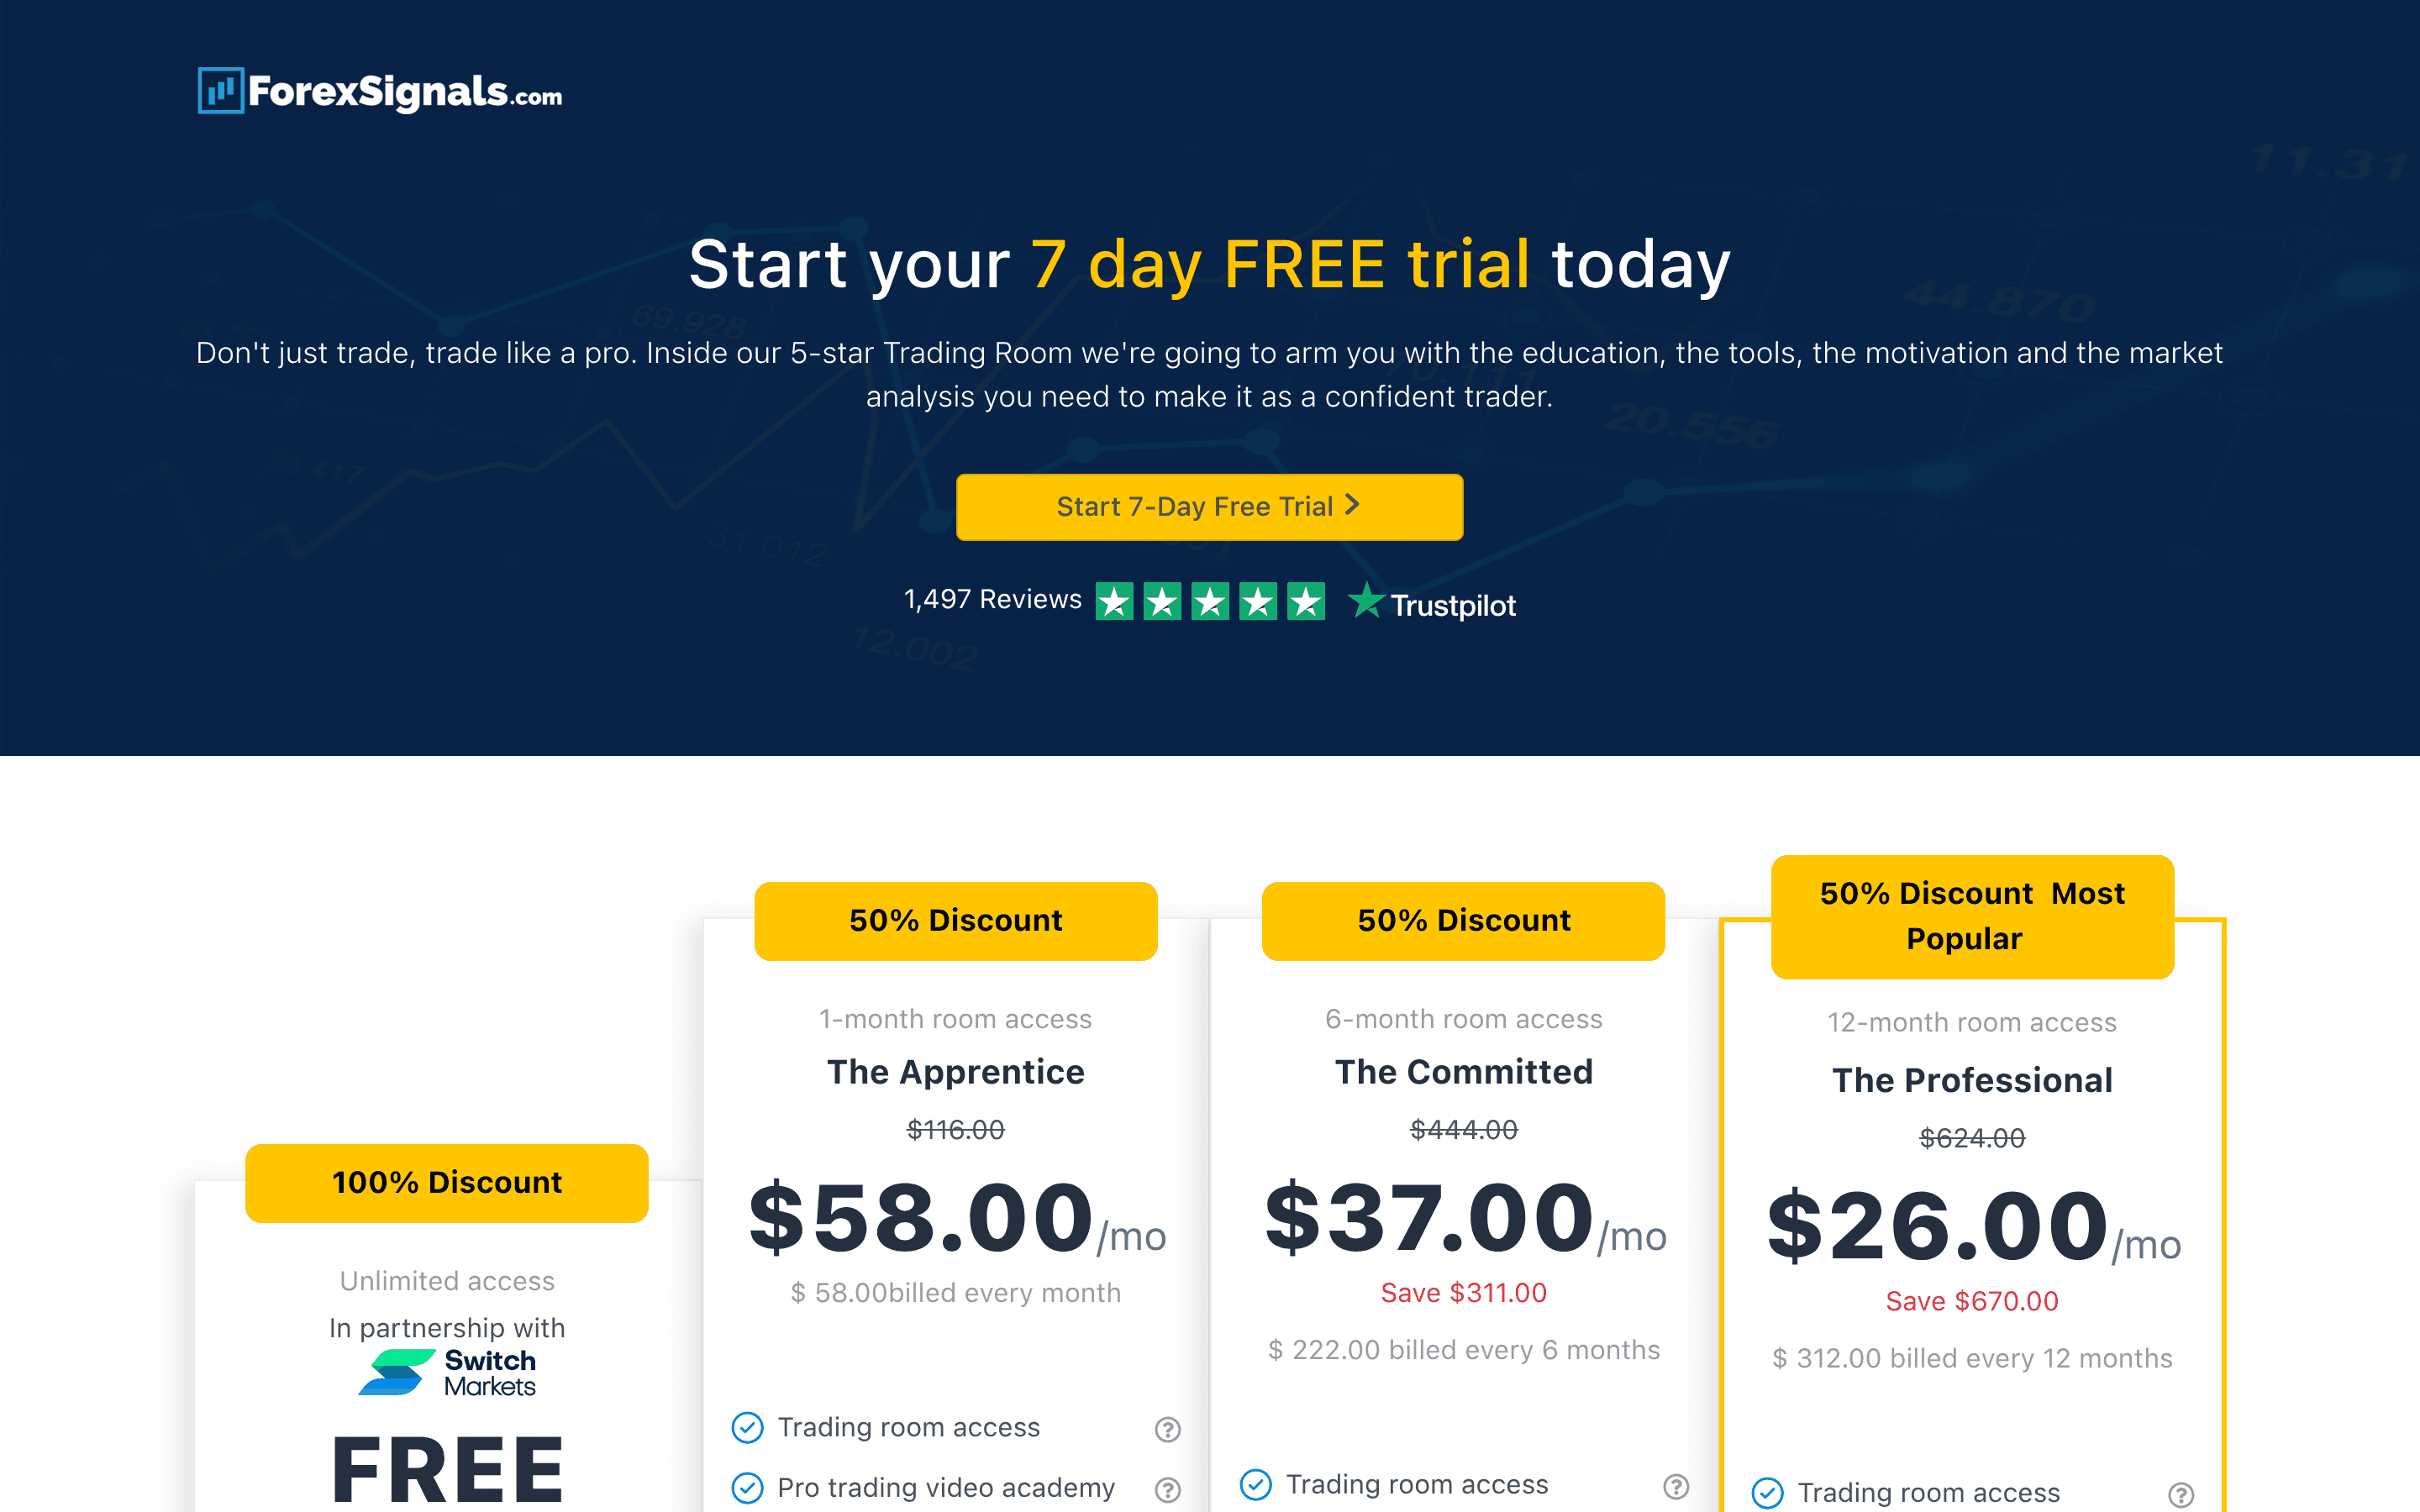
- Headline success claim: Learn2Trade: "76% success rate"; Forex GDP: "80 to 95% success rate"; Generic Telegram VIP group: Varies; Systemly: None advertised
- Independent check of that claim: Learn2Trade: None found; Forex GDP: Myfxbook linked, not audited; Generic Telegram VIP group: Usually none; Systemly: Not applicable; outcomes recorded per plan
- Entry: Learn2Trade: Yes; Forex GDP: Yes; Generic Telegram VIP group: Often a zone; Systemly: One entry level
- Stop loss: Learn2Trade: Yes; Forex GDP: Yes; Generic Telegram VIP group: Usually; Systemly: Yes, checked by code
- Size for your balance: Learn2Trade: "Amount to risk"; Forex GDP: Not stated; Generic Telegram VIP group: Rarely; Systemly: Lots for your balance and risk %
- Reasoning: Learn2Trade: Analysis included; Forex GDP: Chart rationale; Generic Telegram VIP group: Rarely; Systemly: Plain English, including what would make it fail
- How many ideas: Learn2Trade: Up to 15 a day; Forex GDP: Not stated; Generic Telegram VIP group: Often 10 to 20 a day; Systemly: Often none, when nothing passes the checks
- Delivery: Learn2Trade: Telegram; Forex GDP: WhatsApp, Telegram, email; Generic Telegram VIP group: Telegram; Systemly: WhatsApp or Telegram alerts, depending on plan
- Price: Learn2Trade: £39 a month to £399 lifetime; Forex GDP: $107 or $217 a month, 14-day free trial; Generic Telegram VIP group: $50 to $300 a month, or free via a partner broker; Systemly: Free plan; paid plans add alerts, more plans and broker execution
- Trustpilot: Learn2Trade: 1.6 from 451 reviews; Forex GDP: 4.8 from 1,035 reviews; Generic Telegram VIP group: Not applicable; Systemly: Not included in our research
Two rows are worth a second look. Systemly gives you fewer ideas, which some traders will see as a weakness, and Forex GDP reaches you on more channels. Forex GDP's Trustpilot score is also far stronger than Learn2Trade's, whose reviews include complaints about missing Telegram access after payment and refused refunds. For the fuller field-by-field picture across six providers, see our comparison of forex signal providers.
Sources: Learn2Trade pricing, Learn2Trade on Trustpilot, Forex GDP signals page, Telegram channel funnel from JP Trading Capital.
Where a paid signal service is the better choice
A paid signal service is the better choice for an experienced trader who already understands stops and sizing, wants a steady flow of ideas, and has the discipline to track every call in a spreadsheet. Forex GDP offers a 14-day free trial and a linked Myfxbook account, which gives that trader something to inspect. Learn2Trade includes an "amount to risk" on its signals, which is more sizing guidance than most Telegram groups give.
Systemly will frustrate someone who wants to be told what to do fifteen times a day. It often says there is nothing worth trading. For a beginner that restraint is a feature. For a trader who wants action, a busier service will feel better.
The 12-point checklist for judging any signal service
Screenshot this. Ask every question of every service, including Systemly.
- Does every signal give one entry price, or a vague zone?
- Does every signal carry a stop, sent before the trade opens?
- Can you see both distances, to the target and to the stop, so you can work out the break-even win rate yourself?
- If a win rate is quoted, does it come with the average win, the average loss and the number of trades?
- Are costs, such as the spread, included in the record?
- Are losing trades shown as openly as winning ones?
- Are calls posted before the move, with a timestamp you can check?
- Does a trade that only reached its first target count as a full win?
- Are trades counted only when price actually reached the entry?
- Is the track record independently verified or audited, or only linked?
- Does the signal give a size for your balance, or at least an amount to risk?
- How does the provider earn money: from your subscription, or from commissions on how much you trade?
The last question deserves a sentence of its own. The same JP Trading Capital source notes: "Per-lot commissions reward volume, which is why these channels fire 10 to 20 signals a day, suggest oversized lots, and love martingale-style 'recovery' entries." A provider paid by your volume has a reason to keep you trading. Ask every service this question, Systemly included, and expect a straight answer.
Red flags and green flags
Red flags:
- A win rate with no distances, no costs and no sample size.
- Results shown only as screenshots. DailyForex, which runs a free channel itself, warns about "fake account screenshots" (DailyForex on Telegram signal channels).
- A "free" VIP tier that requires you to trade with a named broker.
- More than a dozen calls a day with no reasoning attached.
Green flags:
- A stop on every call, set before entry.
- A record that shows the losers and how far each trade went against you first.
- A plain explanation of what would make the trade fail.
- A size worked out for your balance, or a clear amount to risk.
How we compared
We compared the headline success claims of Learn2Trade, Forex GDP and ChartAI with what each provider publishes about entries, stops, size, reasoning and verification. Competitor facts come from their own pricing pages, Trustpilot and the research sources linked in this article, all checked on 24 September 2026. The win-rate arithmetic uses illustrative distances, not any provider's real trades. Prices and claims change, so check each provider's current page before paying.
FAQ
Are forex signals reliable?
Some are more transparent than others, but a headline win rate alone is weak evidence of reliability. A signal with a 10-pip target and a 30-pip stop needs a 75% win rate to break even, and loses money once spreads are added. Judge a service on its stops, target distances, costs and a full record of outcomes, including losing trades.
Do forex signals work?
They can deliver trade ideas, but whether following them works depends on the distances, the costs, your position size and whether the record is honest. A coin flip "wins" about 75% of the time when the target is three times closer than the stop. Without the distances and a complete record, a win rate cannot tell you if a service works.
Are forex signals a scam?
Only a regulator or court can call a specific service a scam, and there is no credible statistic for how many signal groups are fraudulent. What you can check is transparency: a stop on every call, entries that actually filled, losers shown openly, and whether the provider earns from your subscription or from your trading volume through a partner broker.
What win rate do you need to break even in forex?
Divide your stop distance by the total of your stop and target distances. A 10-pip target with a 30-pip stop needs 75%. A 30-pip target with a 10-pip stop needs only 25%. At a 40% win rate on that second setup, you gain about 6 pips per trade before costs. Costs such as spreads raise the break-even rate.
Why doesn't Systemly publish a headline success figure?
It deliberately advertises no single percentage, because a figure without the distances and costs behind it can mislead. Instead it shows the full plan before the trade, including the stop, targets, size and what would make it fail, and records afterwards which level price reached and how far it went against the trade first. The public feed of community scans shows real plans.
How can I check a signal provider's track record?
Ask for every trade, not a summary. Check that each call was posted before the move, that entries actually filled, that losses are included and that spreads are counted. An audited account is stronger evidence than a linked one. Then work out the break-even win rate from the average stop and target distances and compare it with the claimed rate.
See the working, not the headline
If you would rather judge a plan by its stop, its targets and what happened next, browse the community scans or start on Systemly's free plan. The terms used in every plan are taught in the Systemly Academy, and you can check any trade's size with the free Risk Doctor tool. For the lot-size side of the story, read our guide to position sizing on gold.
Sources
- Learn2Trade pricing and signal contents: https://learn2.trade/forex-signals
- Learn2Trade on Trustpilot: https://www.trustpilot.com/review/learn2.trade
- Forex GDP signals page: https://www.forexgdp.com/forex-signals/
- Telegram signal funnel and per-lot commissions, JP Trading Capital: https://www.jptradingcapital.com/blog/en/free-forex-signals-telegram
- Gold signal channel tactics, Vasily Trader: https://www.vasilytrader.com/post/how-scam-gold-signals-channels-on-telegram-fake-trading-results-xauusd-groups
- DailyForex on Telegram signal channels: https://www.dailyforex.com/forex-brokers/best-forex-brokers/top-signals-telegram
- r/trading212 thread on signal channels: https://www.reddit.com/r/trading212/comments/1j726ss/
- r/FakeGuru thread on signal groups: https://www.reddit.com/r/FakeGuru/comments/1ulo1ks/
- Systemly: https://www.systemly.ai
- Systemly community scans: https://app.systemly.ai/scans
- Systemly Academy: https://www.systemly.ai/academy
- Systemly Risk Doctor: https://app.systemly.ai/tools/risk-doctor
Trading forex and CFDs carries a high risk of losing money, and most retail accounts do. Systemly is an educational and trade-planning tool. It does not provide financial advice or personal recommendations, and it is not authorised by the FCA to do so. Past outcomes do not predict future results.