
TradingView XAUUSD guide: which gold feed to use, why your broker's chart differs, and UK and Dubai session times
 Systemly Team
"Worst ever charts. no correct price movement very much difference of price from comex chart." A MetaTrader 5 user left that one-star review on Trustpilot on 12 May 2026. The platform may not have been the real problem. The reviewer appears to have been comparing two different kinds of gold and expecting them to agree.
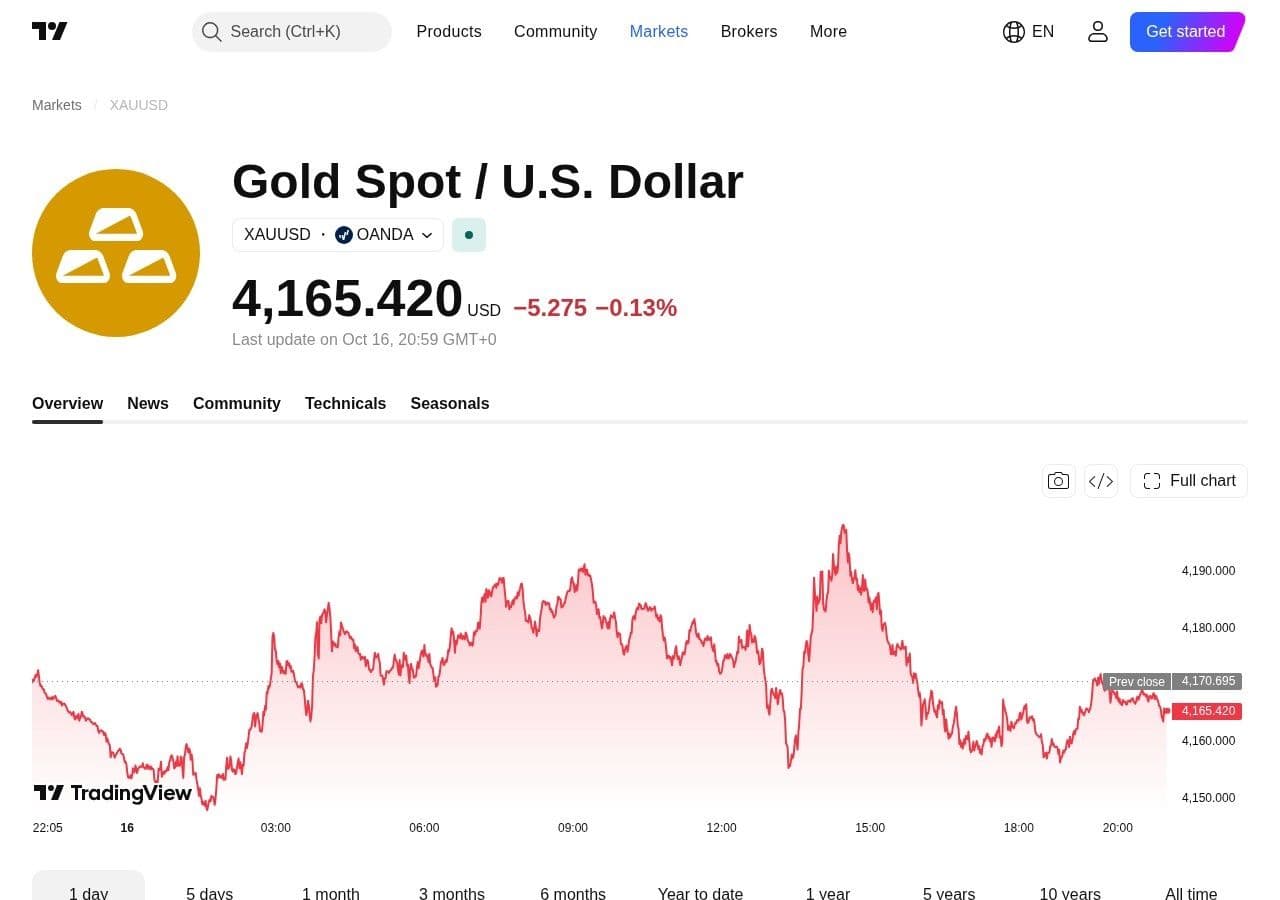
Type "XAUUSD" into TradingView and you meet the same trap from the other side. The default symbol page runs on OANDA's feed, while the ideas beneath it use IC:XAUUSD, TVC:GOLD, FX:XAUUSD and several more. They are all "gold", and they will not show the same high, low or daily candle.
The short answer: draw your levels on your own broker's XAUUSD feed inside TradingView where it exists, because that is the price your stop will meet. Use composites for the bigger picture, and keep futures charts for futures trading.
Quick answer: On TradingView, the best XAUUSD feed is the one closest to where your order fills: your broker's own symbol if TradingView carries it, otherwise a spot broker feed rather than a composite or a futures chart. Expect small gaps between spot brokers and larger ones against COMEX futures. Gold's busiest window, the London and New York overlap, is 13:00 to 17:00 UK and 16:00 to 20:00 Dubai until 24 October 2026, then 17:00 to 21:00 Dubai in winter. TradingView is the better tool for drawing and exploring gold. Systemly is the better tool when you want the trade itself drawn on the chart and sized for your account.
Systemly publishes this comparison. We have tried to be fair, and every TradingView fact below is sourced and dated 13 October 2026.
Which XAUUSD should you pick on TradingView?
TradingView is a charting platform. It shows you the market and gives you tools to analyse it, but it does not hold your money or fill your orders. For gold, that means the price on your screen and the price at your broker come from different places unless you make them match.
The default XAUUSD page uses OANDA's feed, and community ideas on the same page (which mislead beginners in ways we set out in TradingView Ideas vs a trade plan) are drawn on IC:XAUUSD, TVC:GOLD, EIGHTCAP:XAUUSD, FX:XAUUSD, FOREXCOM:XAUUSD and CAPITALCOM:XAUUSD (TradingView XAUUSD symbol page). People notice: "tradingview xauusd oanda" appears in Google's UK autocomplete.
The feeds fall into three families. Broker feeds, such as OANDA, FOREX.com or Capital.com, are one broker's own price, and TradingView lists forex and CFD broker feeds as real-time and free on every plan (TradingView data coverage). Composites blend many sources: TradingView says "ICE symbols are composite, meaning they consist of data received from dozens of contributors", with no daily volume, and "Trading hours might also vary depending on the provider" (TradingView support on ICE). Futures, such as COMEX gold, are an exchange contract with its own price and expiry, not the spot XAUUSD that most UK and UAE CFD and spread-bet accounts trade.
A prop-firm education blog puts the rule plainly: "Analyze on the feed closest to where you execute" (ForTraders, Spanish). Pepperstone's help page agrees: "Certain instruments may have different symbols between brokers" (Pepperstone support).
Why does your broker's gold chart differ from TradingView?
The common mistake is to treat a small price difference as a fault. The consequence is that traders switch feeds, blame the platform or nudge a stop by eye, then cannot work out why it was hit on one screen and not the other. Think of it like weighing yourself on the bathroom scales at home and then at the gym. Both can be honest and still disagree a little, so the sensible habit is to use the same scales every time.
Five things cause the gap.
- Different liquidity. Spot gold has no single exchange (our explainer on what liquidity means in trading covers why that matters), so each broker prices from its own providers. As one BabyPips member put it, "naturally different 'brokers' offer different price quotes because they're not offering the same product" (BabyPips forum).
- Bid, ask or mid. Most charts plot the bid, so a buy fills above the candle you see. Some platforms plot an averaged mid price (BabyPips forum on charting sites and brokers).
- Spread. Spreads widen around NFP and FOMC, which is often when gold moves fastest (ForTraders, as above).
- Spot or futures. Spot XAUUSD is "Broker-dependent, based on spot price", while futures use "Standardized, exchange-set pricing" and expire (StoneX on XAU vs gold futures).
- When the day ends. Platforms close the daily candle at different times, which changes the daily high, low and close.
ForTraders puts typical gaps at $0.20 to $0.60 between two spot brokers, and $1.00 to $2.00 or more between spot and COMEX futures. Treat those as one source's rough ranges. We could not confirm the size of the futures premium on any given day.
- Your broker's feed: Example symbols: the XAUUSD tagged with your broker's name; Best used for: Entries, stops and targets; Watch out for: Matches only your broker
- Another spot broker: Example symbols: OANDA:XAUUSD (the default), FX:XAUUSD; Best used for: Analysis when your broker is not listed; Watch out for: Gaps of roughly $0.20 to $0.60
- Composite: Example symbols: IC:XAUUSD, TVC:GOLD; Best used for: Weekly and daily context; Watch out for: No volume on ICE; hours vary
- Futures: Example symbols: COMEX gold contracts; Best used for: Futures trading; Watch out for: Gaps of roughly $1.00 to $2.00 or more; monthly rolls
Worked example: what a $1.50 feed gap does to a $4.00 stop
The numbers here are illustrative, and the contract size is an assumption you must check with your broker.
Take a £500 account. At an assumed $1.34 to the pound, that is $670, and risking 1% means risking $6.70.
- Assume 1 standard lot of gold is 100 ounces, so a $1 move is worth $100 per lot.
- Put the stop $4.00 below the entry. Some brokers show that as 400 points, others as 40 pips.
- The loss on 1.00 lot over $4.00 is $4.00 × 100 = $400.
- Lots = $6.70 ÷ $400 = 0.01675. The minimum is usually 0.01, so round down to 0.01.
- Real risk = 0.01 × $400 = $4.00, about 0.6% of the account. Rounding up to 0.02 would risk $8.00, about 1.2%.
For a reader in Dubai, at the official peg of AED 3.6725 to the US dollar, the 1% budget is about AED 24.61 ($6.70 × 3.6725) and the actual $4.00 risk is about AED 14.69.
Now suppose you drew that stop on a futures chart sitting $1.50 above your broker's spot price. The stop is misplaced by $1.50, which is 37.5% of the stop distance ($1.50 ÷ $4.00). Even spot-to-spot gaps count: $0.60 is 15% of a $4.00 stop. On a tight gold stop, the feed can decide whether you are stopped out.
The free Risk Doctor tool checks sizing like this from your balance, and our guide to position sizing, the part signals leave out, covers the rounding problem in detail.
Futures charts carry two more traps. Gold futures "expire monthly", so the chart jumps when one contract hands over to the next (TradingView educational idea, 27 May 2025). And TradingView's data page lists CME Group data (E-mini) as delayed 10 minutes unless you pay $9.95 a month. If the same delay applies to the gold contract you open, a free futures chart is a picture of ten minutes ago, so check the delay label on the symbol.
Gold session times in UK time and Dubai time
Gold trades nearly around the clock on weekdays, but not evenly. Our search data shows UK interest in "is xauusd market closed today" up 4,300% and "gold trading hours" up 300% (Google Trends, 12 months to October 2026).
The times below use the BabyPips convention: London and New York run 08:00 to 17:00 local time, Tokyo 09:00 to 18:00 (BabyPips sessions guide). Other sources differ by an hour, so read them as approximate. Dubai stays on UTC+4 all year (timeanddate.com).
Here is the conversion for NFP, released at 08:30 New York. In summer New York is UTC-4, so that is 12:30 UTC: 13:30 in the UK on BST (UTC+1) and 16:30 in Dubai (UTC+4). In winter New York is UTC-5, so 08:30 is 13:30 UTC: 13:30 in the UK on GMT and 17:30 in Dubai.
- London session: Summer (to 24 Oct 2026): UK / Dubai: 08:00 to 17:00 / 11:00 to 20:00; Out-of-sync week (25 to 31 Oct 2026): UK / Dubai: 08:00 to 17:00 / 12:00 to 21:00; Winter (1 Nov 2026 to 13 Mar 2027): UK / Dubai: 08:00 to 17:00 / 12:00 to 21:00
- London and New York overlap: Summer (to 24 Oct 2026): UK / Dubai: 13:00 to 17:00 / 16:00 to 20:00; Out-of-sync week (25 to 31 Oct 2026): UK / Dubai: 12:00 to 17:00 / 16:00 to 21:00; Winter (1 Nov 2026 to 13 Mar 2027): UK / Dubai: 13:00 to 17:00 / 17:00 to 21:00
- US CPI or NFP: Summer (to 24 Oct 2026): UK / Dubai: 13:30 / 16:30; Out-of-sync week (25 to 31 Oct 2026): UK / Dubai: 12:30 / 16:30; Winter (1 Nov 2026 to 13 Mar 2027): UK / Dubai: 13:30 / 17:30
- FOMC statement: Summer (to 24 Oct 2026): UK / Dubai: 19:00 / 22:00; Out-of-sync week (25 to 31 Oct 2026): UK / Dubai: 18:00 / 22:00; Winter (1 Nov 2026 to 13 Mar 2027): UK / Dubai: 19:00 / 23:00
- Daily roll (17:00 New York): Summer (to 24 Oct 2026): UK / Dubai: 22:00 / 01:00 next day; Out-of-sync week (25 to 31 Oct 2026): UK / Dubai: 21:00 / 01:00 next day; Winter (1 Nov 2026 to 13 Mar 2027): UK / Dubai: 22:00 / 02:00 next day
- COMEX gold futures break: Summer (to 24 Oct 2026): UK / Dubai: 22:00 to 23:00 / 01:00 to 02:00; Out-of-sync week (25 to 31 Oct 2026): UK / Dubai: 21:00 to 22:00 / 01:00 to 02:00; Winter (1 Nov 2026 to 13 Mar 2027): UK / Dubai: 22:00 to 23:00 / 02:00 to 03:00
The futures break (17:00 to 18:00 New York) comes from a secondary source because the CME page did not render (ForTraders on gold futures hours). Spot hours vary by broker, so check your broker's contract page.
The next out-of-sync week starts on 25 October 2026, when the UK leaves summer time and New York waits until 1 November. That week, US data lands at 12:30 UK, and the Fed's decision on Wednesday 28 October lands at 18:00 UK and 22:00 Dubai (Federal Reserve FOMC calendar). Dubai traders feel the change on 1 November instead, when US data moves from 16:30 to 17:30 Dubai.
On the 17:00 New York convention, the gold week opens at about 22:00 on Sunday UK time, which is about 01:00 Monday in Dubai in summer and 02:00 Monday in winter. Some brokers open earlier. For every TradingView setting that affects this, see our guide to TradingView time zone and session settings for UK and Dubai traders, and for the wider picture, forex trading sessions and market hours.
Why the daily gold candle is not the same everywhere
A daily candle is a 24-hour slice, and platforms cut it in different places. A BabyPips member wrote in 2020 that "Tradingview has NY close so you can compare broker charts to that", and another that "Its common for UK-based brokers to close their daily charts at about 2200hrs UK time" (BabyPips forum on daily closes).
Many MetaTrader brokers set server time to GMT+2 in winter and GMT+3 in summer, so that server midnight equals 17:00 New York and the week has "exactly five 24-hour candles" (VT Markets on server time). Feeds with a short Sunday candle produce six, which shifts anything calculated on daily bars. Changing TradingView's chart time zone only relabels the time axis; it does not move the candles (FriendOfTheTrend guide). So when a level comes from "yesterday's high", know whose yesterday it is. Our explainer on why broker charts and charting platforms show different prices goes further.
Where TradingView is the better choice for gold
TradingView is an excellent gold chart, and even its critics say so. One Trustpilot reviewer who gave a single star still wrote that "The charts, tools and overall platform are very good" (Claus Moeller, 10 September 2026, Trustpilot). The UK App Store rates the app 4.8 from about 50,000 ratings. Dubai readers weighing other apps can compare them in the best charting apps for gold traders in the UAE.
TradingView is the better choice if you draw your own structure, such as Fibonacci retracements, with its 110+ drawing tools (TradingView features), if you want to compare spot, composite and futures gold side by side, or if you want free real-time broker feeds on the free plan. It is also the right tool if you write Pine Script, trade gold futures, or want free paper trading on any order you like. Systemly does none of the first two, and its own paper trading only practises its plans.
What Systemly does with a gold plan
Systemly (systemly.ai) is a UK-built forex and gold trade-planning app that turns live price data into a complete trade plan, with entry, stop, targets, position size and plain-English reasoning, and teaches the terms in a built-in academy of 32 courses. It reads live price bars, never a screenshot. A scan is refused if the data is stale, has gaps or carries a future timestamp, and weekend quote bars on metals are thrown away.
A charting platform is a blank canvas. Systemly is the same kind of chart with the plan already drawn on it: the position box, entry, stop, targets, the stop moving to entry after the first target, the dip zone and the hold level. A numbered moves card says when to wait, when to get in, what to do at each target and when the plan is wrong. One money figure, at the lot size the card prints, includes trading cost at the stop.
For gold in particular, Systemly never shows odds on gold; odds appear only where they were measured, written as a floor. Sessions are drawn in your own time zone and follow London's and New York's own daylight saving, so a trader in London or Dubai sees them in the right place during the out-of-sync week without changing a setting. On a closed week the chart says the last price is Friday's close. When the strategy's checks fail, the answer is "no trade" with the failed checks listed, and gold is one of 13 measured markets where Day and Swing plans can show the price that would change the answer.
Systemly does not fix the feed problem for you: your broker's price is still the one that fills. Gold is on the free plan, and so is paper trading (up to 3 open trades), so a gold plan can be practised on real prices, with spreads and costs, at your real account size before you risk money. Chart layers, and the export that draws the plan on TradingView as a Pine Script, come with Starter and above, so you can plan in Systemly and keep drawing in TradingView. Our gold trading strategy guide shows how a plan like this is built.
How we compared
We read TradingView's symbol, data coverage and support pages, broker help pages, BabyPips forum threads and a prop-firm guide on gold feeds, all checked on 13 October 2026. Session and data times come from our UK and UAE research tables, calculated with the IANA time-zone database, and each conversion here was checked against them. Systemly features come from its October 2026 product notes. Prices, feeds and broker hours change, so check them before relying on them.
FAQ
Which XAUUSD feed should I use on TradingView?
Use your own broker's XAUUSD symbol if TradingView carries it, because that is the price your stop and target will meet. If your broker is not listed, use a spot broker feed such as the default OANDA:XAUUSD rather than a composite or a futures chart. Keep composites like TVC:GOLD for big-picture levels, where a small gap does not change the decision.
Why is TradingView's gold price different from my broker's?
Spot gold has no single exchange, so each broker prices from its own liquidity. Charts also differ on whether they plot the bid or a mid price, spreads widen around US data, and platforms end the daily candle at different times. One education guide puts typical gaps at $0.20 to $0.60 between spot brokers and $1.00 to $2.00 or more against futures.
Is TVC:GOLD the same as XAUUSD?
Not exactly. TVC:GOLD is a composite gold price built for broad analysis, while a broker's XAUUSD is that broker's own spot price. They track each other closely, but highs, lows and closes can differ slightly, so use the composite for context and your broker's feed for precise stops.
What time does gold open in Dubai?
On the common convention that the trading week opens at 17:00 New York on Sunday, gold opens at about 01:00 on Monday in Dubai during US summer time and about 02:00 on Monday in US winter time. Dubai does not change its clocks, so the shift comes from New York. Some brokers open earlier, so check your broker's contract hours.
What are the best gold trading hours in UK time?
Gold is usually most active when London and New York overlap, 13:00 to 17:00 UK time for most of the year. In the out-of-sync week from 25 to 31 October 2026, the overlap runs from 12:00 to 17:00 UK. US data such as NFP lands at 13:30 UK, or 12:30 in that week. Busy hours bring wider spreads as well as movement.
Does Systemly give odds on gold trades?
No. Systemly shows odds only on markets where they were measured, written as a floor, and never on gold. A gold plan shows the entry, stop, targets, the moves to make at each step and one money figure with costs. If the strategy's checks fail, it says "no trade" and lists which checks failed, rather than offering a weaker plan.
See a gold plan drawn on a live chart
If you already draw gold on TradingView, the quickest test is to open a real gold plan and compare it with your own markup. Browse the community feed of real Systemly plans, or start a free gold plan at Systemly.
Sources
- TradingView XAUUSD symbol page: https://www.tradingview.com/symbols/XAUUSD/
- TradingView support, ICE vs other forex providers: https://in.tradingview.com/support/solutions/43000480629-what-is-the-difference-between-ice-and-other-forex-providers/
- TradingView data coverage: https://www.tradingview.com/data-coverage/
- TradingView features: https://www.tradingview.com/features/
- Google autocomplete for "tradingview xauusd": https://suggestqueries.google.com/complete/search?client=firefox&hl=en-GB&gl=gb&q=tradingview%20xauusd
- ForTraders, XAU/USD on TradingView (Spanish): https://fortraders.com/es/blog/xau-usd-tradingview-grafico-oro
- ForTraders, gold futures trading hours: https://www.fortraders.com/blog/gold-futures-trading-hours
- Pepperstone support on chart differences: https://www.pepperstone.com/en/support/ive-noticed-that-my-charts-look-different/
- StoneX, XAU vs gold futures: https://futures.stonex.com/blog/xau-vs-gold-futures-whats-the-difference-and-why-it-matters-to-traders
- TradingView idea on XAUUSD vs futures: https://es.tradingview.com/chart/XAUUSD/kPmeILvk-Trading-Gold-Know-the-Difference-Between-XAU-USD-and-Futures
- MetaTrader 5 on Trustpilot: https://ie.trustpilot.com/review/metatrader5.com
- TradingView on Trustpilot: https://www.trustpilot.com/review/tradingview.com
- TradingView on the UK App Store: https://apps.apple.com/gb/app/tradingview-track-all-markets/id1205990992?see-all=reviews
- BabyPips forum, different price movements: https://forums.babypips.com/t/charts-showing-slightly-different-price-movements/143079
- BabyPips forum, charting sites and broker graphs: https://forums.babypips.com/t/why-are-charting-website-and-broker-graphs-different/83132
- BabyPips forum, daily candle close times: https://forums.babypips.com/t/3-brokers-different-daily-candle-close-times/310851
- BabyPips forex sessions: https://www.babypips.com/learn/forex/forex-trading-sessions
- VT Markets server time: https://www.vtmarkets.com/faq/vt-markets-server-time-gmt-offset-all-you-need-to-know/
- FriendOfTheTrend, TradingView time zone: https://friendofthetrend.com/tradingview/how-to-change-timezone/
- timeanddate.com, Dubai time zone: https://www.timeanddate.com/time/zone/united-arab-emirates/dubai
- UK clock changes: https://www.gov.uk/when-do-the-clocks-change
- Federal Reserve FOMC calendar: https://www.federalreserve.gov/monetarypolicy/fomccalendars.htm
- Google Trends, 12 months to October 2026 (Systemly's own search research)
- Systemly: https://www.systemly.ai
- Systemly community scans: https://app.systemly.ai/scans
- Systemly Risk Doctor: https://app.systemly.ai/tools/risk-doctor
Trading forex and CFDs carries a high risk of losing money, and most retail accounts do. Systemly is an educational and trade-planning tool. It does not provide financial advice or personal recommendations, and it is not authorised by the FCA or licensed in the UAE to do so. Past outcomes do not predict future results.