
AI chart analysis apps compared: why a screenshot is the wrong input for a trade
 Systemly Team
It is ten past eight on a weekday. The gold chart on your phone has a shape you half recognise. You take a screenshot, crop out the battery icon, and upload it to an app that promises to tell you what it sees. Moments later you have an entry, a stop and two targets from an app whose website advertises "99% accuracy".
That figure belongs to TradeGPT, and it is worth reading carefully. It describes how accurately the app reads the chart in the picture. It does not describe how often the trades work.
That distinction is the whole of this article. AI chart apps are quick, cheap and genuinely clever at describing an image. But a screenshot is a picture of price, not price itself, and a picture leaves out most of what a safe trade needs. If you want a trade you can size and check, start from the price data, not from a photo of it.
Quick answer: AI chart analysis apps such as TradeGPT, ChartsGPT, Chart AI and ChartAI read an image of a chart and return levels or labels, which suits quick, low-cost second opinions on any market you can capture. A screenshot cannot hold exact prices, bars off-screen, your account balance or whether the data is stale. Systemly works from live price data instead, sizes the trade for your balance and records what happened afterwards, which suits beginners who want a plan they can check. It is built mainly for forex and gold.
Systemly publishes this comparison. We have tried to be fair, and every competitor fact below is sourced and dated 24 September 2026.
What is an AI chart analysis app?
An AI chart analysis app is a phone app that takes an image of a price chart, runs it through an AI model and returns a reading: a direction, levels, labels, or a full set of entry, stop and targets. All four apps below work from an image of a chart. Prices and claims were checked on 24 September 2026.
- TradeGPT, from Hangzhou Impulsio Technology, returns an entry, a stop and targets. It costs $7.99 to $8.99 a week, or $39.99 to $49.99 a year. Its site advertises "99% accuracy", which refers to reading the chart, not to trade outcomes.
- ChartsGPT returns an entry, a stop, targets and an invalidation level. It costs $6.99 a week or $12.99 a month.
- Chart AI, from Chart AI Nominees Pty Ltd, labels market structure, order blocks and fair value gaps (FVGs). It costs $3.99 a week or $14.99 a month.
- ChartAI, at profitgpt.app, advertises "95% Signal Accuracy". We could not find a stated method for how that figure is measured.
These are real products built by people who have clearly thought about traders' problems. ChartsGPT's invalidation level, in particular, is a field most Telegram signals never give. The issue we want to examine is not the companies. It is the input they all share.
What a screenshot cannot contain
One chart-app maker's own blog concedes the point in seven words: "A screenshot is a picture of price". Here is what that picture leaves out.
The bars off the edge of the screen
A screenshot shows whatever fits in the window you happened to have open. The swing high from yesterday afternoon, the level price bounced from last week, the gap left over the weekend: if they are off-screen, they do not exist for the model. A stop placed just beyond "the recent high" may be placed beyond the wrong one.
Exact prices
A chart image contains pixels, not prices. The model estimates a level by where a candle sits against the price axis. On gold, a few pixels can mean a few dollars. On a 0.01-lot trade, where each $1 move is worth about $1 (assuming 100 ounces per standard lot, which varies by broker), a misread of $3 on the stop is a $3 difference in your loss. On larger sizes it scales accordingly.
The timestamp
Unless the image shows the time, the model does not know when the chart was captured. A screenshot taken before lunch and uploaded after lunch describes a market that has already moved on.
Your account balance
Position size depends on your balance and the percentage you are willing to risk. Neither appears in a chart. So a screenshot can, at best, give you levels. The step that decides how much you lose if it goes wrong, the lot size, has to come from somewhere else, and for many beginners it comes from a guess.
Whether the data behind it was stale
A chart can freeze, skip bars or show a gap after a feed problem. In a picture, a frozen chart looks exactly like a quiet one.
The common mistake is to treat a confident answer about an image as a confident answer about the market. The consequence is a trade built on estimated prices, an incomplete history and no size.
Think of it like judging a house from one photograph on a property website. The photo can be perfectly accurate. It can still hide the damp in the corner that was out of frame, the date it was taken, and the fact that the roof has since been replaced. Buyers do not rely on the photo. They read the survey, which works from measurements of the whole building. A trade deserves the survey.
"99% accuracy" at what?
Accuracy claims in this category usually measure one of two very different things.
The first is reading accuracy: did the app correctly describe what is on the chart? Did it spot the trend, the pattern, the level? This is what TradeGPT's "99% accuracy" refers to, by its own description. It is a meaningful claim about image recognition.
The second is outcome accuracy: when the app says "sell here, stop there, target there", how often does the trade reach the target before the stop? That is the number a trader actually cares about, and a reading score says nothing about it.
A chart can be read perfectly and the trade can still fail. The pattern can be exactly what the app says it is, and the market can simply do something else. Outcome figures have their own trap as well. A trade with a 10-pip target and a 30-pip stop needs a 75% win rate just to break even before costs, and with that shape, random price movement would reach the target first about 75% of the time. So even an outcome percentage means little unless you also know the distances behind it.
When an app says "95% Signal Accuracy" with no method, the fair response is not to assume the worst. It is to ask three questions: what exactly is being measured, over which trades and how many, and who checked it?
What independent testing found when AI reads charts
The best public test we found was not of these apps specifically, and it has limits you should know about. In August 2025, DayTrading.com tested six AI models with more than 180 prompts. It found made-up prices, arithmetic mistakes, no risk warnings, and pattern errors in about 60% of chart prompts, such as a descending triangle described as a bull flag. The test is not peer-reviewed and comes from a commercial site.
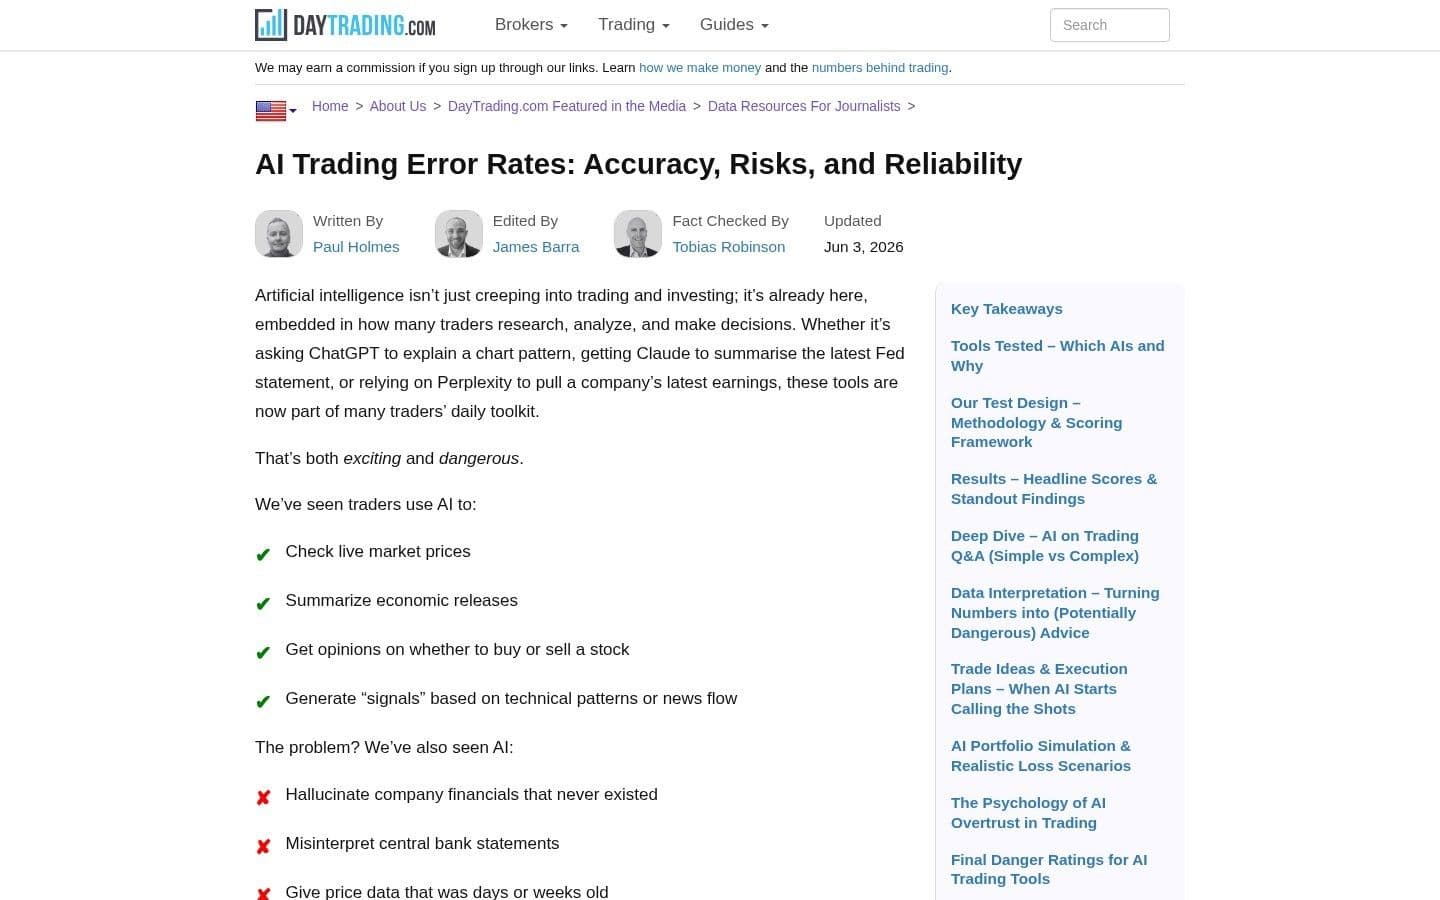
It does not tell you how any app in this article performs. It does show the kind of failure that image-based chart reading is prone to. Estimating from pixels invites exactly the errors the test found: a price that is slightly wrong, a pattern named with confidence but mislabelled, and arithmetic that nobody checks.
What the weekly price really costs
Weekly pricing is common in this category, and it is worth doing the sums before you tap subscribe. Prices are as listed on 24 September 2026.
- TradeGPT: Weekly price over 52 weeks: $7.99 × 52 = $415.48; Monthly price over 12 months: Not listed; Annual option: $39.99 to $49.99
- ChartsGPT: Weekly price over 52 weeks: $6.99 × 52 = $363.48; Monthly price over 12 months: $12.99 × 12 = $155.88; Annual option: Not listed
- Chart AI: Weekly price over 52 weeks: $3.99 × 52 = $207.48; Monthly price over 12 months: $14.99 × 12 = $179.88; Annual option: Not listed
A weekly plan left running for a year can cost several times the annual option. That is not a trick on anyone's part. It is simply what weekly billing adds up to, and it is easy to miss when the first charge is under $10.
The data-first alternative
Systemly (systemly.ai) starts at the other end: with the numbers, not the picture.
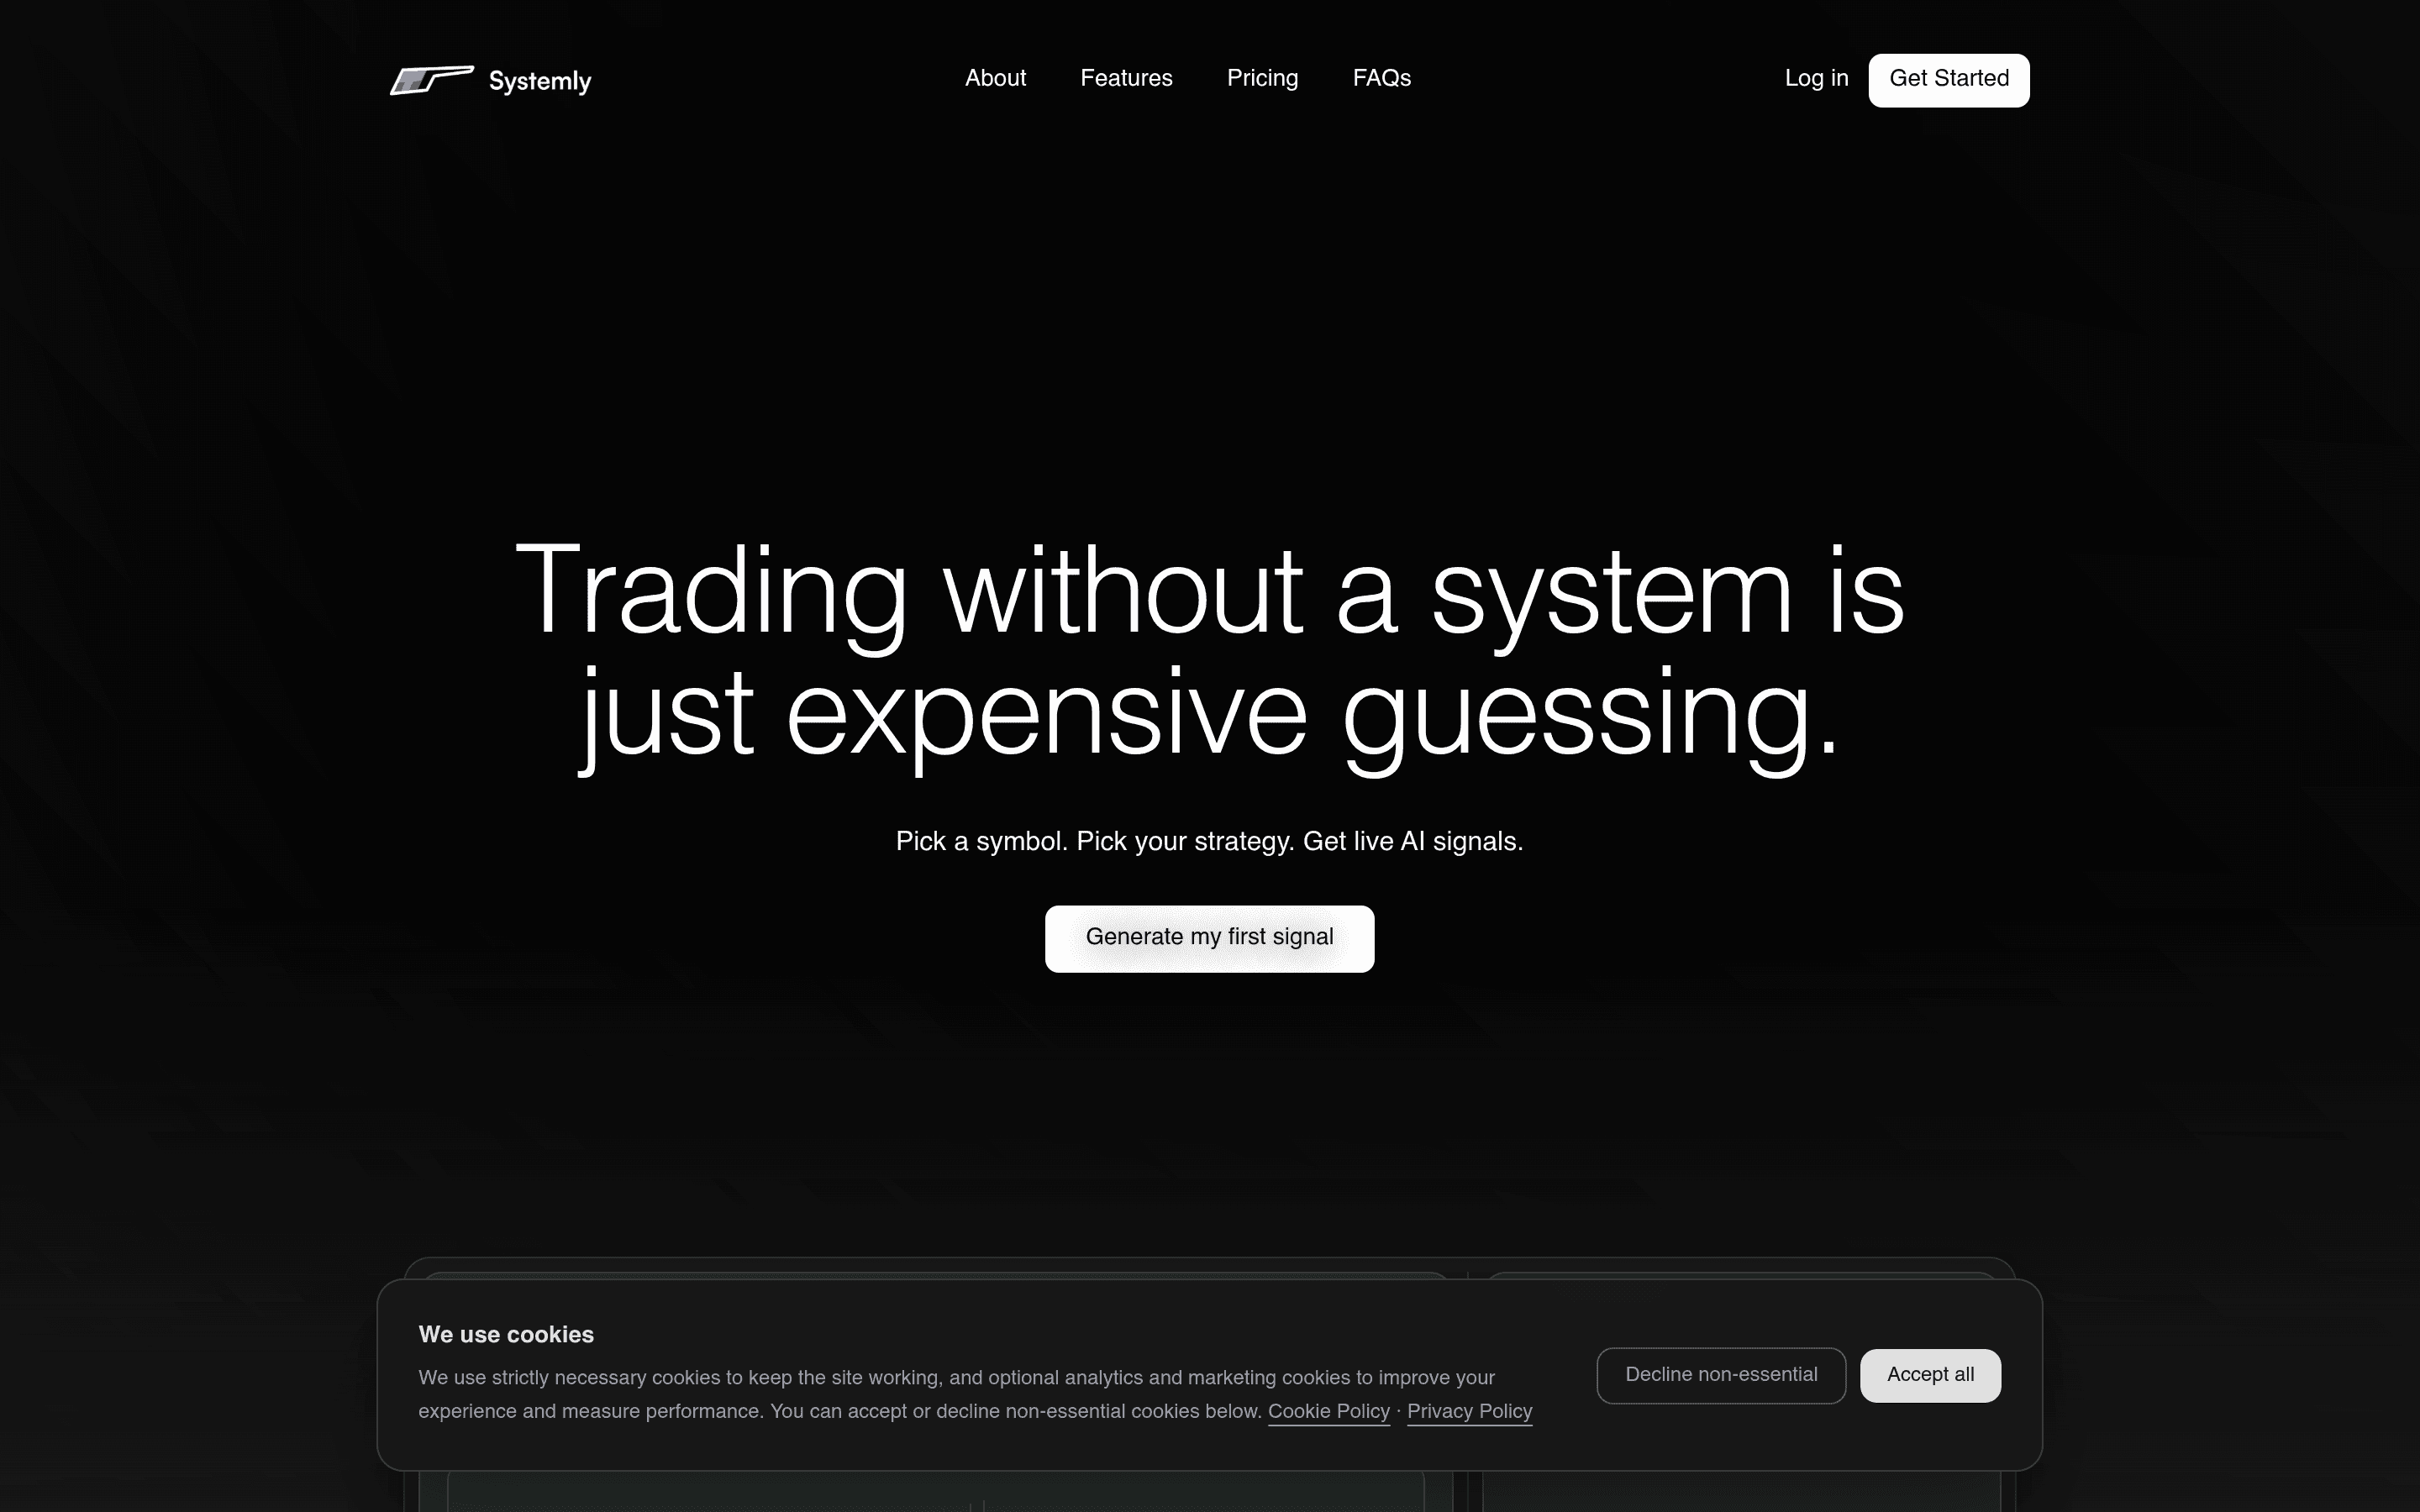
Systemly is a UK-built forex and gold trade-planning app that turns live price data into a complete trade plan, with entry, stop, targets, position size and plain-English reasoning, and teaches the terms in a built-in academy of 32 courses.
Go back through the five gaps above and set the data-first approach against each.
- Bars off-screen. The app works from the price bars themselves (open, high, low, close and volume), not from a window someone chose to capture. Deterministic code reads the market structure from that data before any AI model is involved.
- Exact prices. Every level comes from recorded prices, and after the AI drafts a plan, the code recomputes every distance rather than trusting the model's arithmetic.
- The timestamp. Every bar carries its time. A scan is refused if the data carries a future timestamp.
- Your balance. You enter your balance and the percentage you want to risk, and the plan calculates the lot size. The same plan shows a different size for every user.
- Stale data. A scan is refused when the price data is stale or has gaps, instead of producing a confident answer about a frozen market.
The code also enforces a minimum stop width and moves a stop that sits on obvious resting liquidity, where stops are commonly hunted. The one-line version is: "The AI reads the chart. The code owns the trade." Here, "the chart" means the price data, not a picture of it.
Often the answer is that there is nothing worth trading. Most moments do not pass the code's first check, so the model is never asked to invent a setup where none exists.
After a plan is sent, Systemly follows it. The log shows the level price reached, the time it got there and how far it moved against the trade first, and losing plans are logged like any other. The public feed of community scans shows real examples. Opening a full plan takes a free login.
AI chart apps vs a data-first plan: the table
- Input: TradeGPT: Chart image; ChartsGPT: Chart image; Chart AI: Chart image; ChartAI: Chart image; Systemly: Live price data
- Price (24 Sept 2026): TradeGPT: $7.99 to $8.99 a week, or $39.99 to $49.99 a year; ChartsGPT: $6.99 a week or $12.99 a month; Chart AI: $3.99 a week or $14.99 a month; ChartAI: Not stated; Systemly: Free plan; paid plans add alerts, more plans and execution
- What it returns: TradeGPT: Entry, stop, targets; ChartsGPT: Entry, stop, targets, invalidation; Chart AI: Structure, order blocks, FVGs; ChartAI: Not stated; Systemly: Entry, stop with reason, laddered targets, size, what would make it fail
- Headline claim: TradeGPT: "99% accuracy" at reading the chart; ChartsGPT: None in our sources; Chart AI: None in our sources; ChartAI: "95% Signal Accuracy", no method stated; Systemly: No headline figure
- Exact prices: TradeGPT: Estimated from the image; ChartsGPT: Estimated from the image; Chart AI: Estimated from the image; ChartAI: Estimated from the image; Systemly: From recorded prices
- Position size for your balance: TradeGPT: Not stated; ChartsGPT: Not stated; Chart AI: Not stated; ChartAI: Not stated; Systemly: Calculated from your balance and risk %
- Refuses stale data: TradeGPT: Cannot tell from an image; ChartsGPT: Cannot tell from an image; Chart AI: Cannot tell from an image; ChartAI: Cannot tell from an image; Systemly: Yes, and gaps and future timestamps
- Record of outcomes: TradeGPT: Not stated; ChartsGPT: Not stated; Chart AI: Not stated; ChartAI: Not stated; Systemly: Every plan tracked, losses included
- Markets covered: TradeGPT: Anything you can capture; ChartsGPT: Anything you can capture; Chart AI: Anything you can capture; ChartAI: Anything you can capture; Systemly: Mainly forex and gold
The last row goes to the image apps, and clearly. If you trade shares, crypto or an obscure index, a screenshot app will look at it, while Systemly is built mainly for forex and gold.
Where an AI chart app is the better choice
An image-based app can be the better choice in three situations.
If you trade markets beyond forex and gold, it can read any chart you can capture. That flexibility is real, and a data-first app focused mainly on forex and gold cannot match it.
If you are learning vocabulary, an app like Chart AI that labels structure, order blocks and fair value gaps on your own chart can be a useful study aid. Treat the labels as a prompt to check your own reading, not as a verdict.
And if you are an experienced trader who already sizes every trade, keeps a journal and wants a quick second pair of eyes, a low-cost weekly app may be all you need. Just cancel the weekly plan when you stop using it.
For a beginner who wants a trade they can actually size and check, the image is the wrong place to start.
A checklist before you trust any AI chart reading
- Does the answer give exact prices, or estimates from a picture?
- Could anything important be off the edge of the screen?
- When was the chart captured, and has price moved since?
- What lot size does the stop allow at 1% of your balance? Work it out yourself, or use Risk Doctor, a free tool that checks a trade's risk and position size before you place it.
- Does the accuracy figure describe reading the chart, or trade outcomes?
- If it describes outcomes, what were the distances to target and stop?
- Is there a record of what happened to past readings, including the ones that failed?
- What will the subscription cost over a year at the billing period you chose?
How we compared
We compared four image-based AI chart apps with Systemly on input, price, what each returns, headline claims, pricing, sizing, stale-data handling, outcome records and market coverage. Prices and claims come from each app's website or App Store listing, checked on 24 September 2026. The DayTrading.com test of six AI models is cited with its limits. App prices change often, so check the current listing before subscribing.
FAQ
What is the best AI chart analysis app?
It depends on what you trade. For any market you can capture on screen, image-based apps like TradeGPT, ChartsGPT and Chart AI give quick readings at low weekly prices. For forex and gold, Systemly works from live price data, sizes the trade for your balance and records outcomes. That suits beginners who want a plan they can check rather than an estimate from a picture.
Is TradeGPT accurate?
TradeGPT advertises "99% accuracy", and that figure refers to reading the chart in the image, not to how often its trades succeed. A chart can be read correctly and the trade can still fail. As of 24 September 2026, TradeGPT costs $7.99 to $8.99 a week or $39.99 to $49.99 a year. Ask any app what its accuracy figure measures.
Can AI analyse a chart from a screenshot?
AI models can describe an image of a chart, name patterns and estimate levels. What a screenshot cannot contain is exact prices, bars off-screen, the timestamp unless visible, your account balance, or whether the data was stale. A 2025 DayTrading.com test of six AI models found pattern errors in about 60% of chart prompts, though it was not peer-reviewed.
What is the best AI trading app in the UK?
For forex and gold, Systemly is a UK-built trade-planning app that turns live price data into a complete plan with entry, stop, targets, position size and reasoning, and teaches the terms in a 32-course academy. It is an educational tool, not authorised by the FCA, and gives no personal recommendations. Image-based apps suit people trading other markets.
Why does the AI chart app not give a lot size?
Lot size depends on your account balance, the risk percentage you choose and the distance to your stop. A chart image contains none of your account details, so an app that reads screenshots cannot size the trade unless you supply them separately. On gold, assuming 100 ounces per standard lot, each $1 of stop distance costs $1 per 0.01 lots.
Are weekly AI trading app subscriptions worth it?
Weekly billing adds up. As of 24 September 2026, TradeGPT at $7.99 a week comes to $415.48 over a year, against $39.99 to $49.99 for its annual option. ChartsGPT at $6.99 a week is $363.48 a year. If you use an app regularly, compare the annual price, and cancel weekly plans you stop using.
If you arrived looking for a chart image analyser, we have set the two approaches side by side, including the cases where an image reader is the better choice.
Start from the data
If you want to see what a plan built from price data looks like, browse the community scans or try Systemly's free plan. To see how a general chatbot compares, read our guide to ChatGPT forex signals vs a purpose-built signal engine, and for paid signal services, our forex signal providers comparison.
Sources
- TradeGPT: https://tradegpt.app/
- ChartsGPT on the App Store: https://apps.apple.com/us/app/chartsgpt-ai-chart-analysis/id6758857719
- Chart AI on the App Store: https://apps.apple.com/us/app/chart-ai/id6636484876
- ChartAI, profitgpt.app: claim as displayed on its site, 24 September 2026
- DayTrading.com, AI model test (August 2025): https://www.daytrading.com/ai/test
- Systemly community scans: https://app.systemly.ai/scans
- Systemly Risk Doctor: https://app.systemly.ai/tools/risk-doctor
Trading forex and CFDs carries a high risk of losing money, and most retail accounts do. Systemly is an educational and trade-planning tool. It does not provide financial advice or personal recommendations, and it is not authorised by the FCA to do so. Past outcomes do not predict future results.